Sunday, 8 December 2013

Assignment 3: Atom economy and yield

"You will need to make some notes on this part of reaction rate science.
This is a guide to the information you will need to include."


Atom economy

The atom economy of a chemical reaction is a measure of the amount of starting materials that become useful products. Inefficient, wasteful processes have low atom economies. Efficient processes have high atom economies, and are important for sustainable development, as they use fewer natural resources and create less waste.

The atom economy of a reaction can be calculated:


Note that, because the total mass of products equals the total mass of reactants, you can put that into the bottom of the fraction in the calculation like this:


For example, what is the atom economy for making hydrogen by reacting coal with steam?

Write the balanced equation:

C(s) + 2H2O(g)    →    CO2(g) + 2H2(g)

Write out the Ar and Mr values underneath:

C(s) + 2H2O(g)    →    CO2(g) + 2H2(g)

12       2 × 18                44           2 × 2

Remember that the Ar or Mr in grams is one mole, so:

total mass of products = 44 + 4 = 48g (note that this is the same as the reactants: 12 + 36 = 48g)
mass of desired product (H2) = 4g
% atom economy = 4⁄48 × 100 = 8.3%

This process has a low atom economy and is therefore an inefficient way to make hydrogen. It also uses a non-renewable resource: coal.


Percentage yield

In practice, it is not always possible to get the calculated amount of product in a reaction:
reversible reactions may not go to completion
some product may be lost when it is removed from the reaction mixture
some of the reactants may react in an unexpected way

The yield of a reaction is the actual mass of product obtained. The percentage yield can be calculated:

For example, the maximum theoretical mass of product in a certain reaction is 20g, but only 15g is actually obtained.

percentage yield = 15⁄20 × 100 = 75%


The maximum theoretical mass of product itself can be calculated using a reacting mass calculation

Friday, 6 December 2013

Assignment 4: Introduction

This is an over view of what is needed to pass the fourth assignment.

In your article you need to:
Describe how different human and natural activities have affected
the Earth and its environment, the land, air and sea. For the natural
activities, you also need to discuss how the atmosphere of the Earth
has changed over the last two hundred million years. Use at least
two human activities and two natural activities.
For the activities that you have chosen above, discuss which has
had the greater impact on the Earth and its environment – human
or natural activities.
Discuss how humans have tried to remedy the effects on the Earth
of the two human activities you chose by carrying out alternative
activities, for example recycling waste instead of using landfill.
What has been the effect of these ‘alternative activities’ on the
environment – has it made it better or worse for the environment?
Identify three possible solutions to the damaging effects on the
Earth and its environment from human activities and natural
events.
Explain and discuss the advantages and disadvantages of each
possible solution to the damaging effects on the Earth and its
environment from human activities and natural events. Give your
conclusion as to which is the best and why.


Thursday, 5 December 2013

Asignment 3: Reaction rates notes

Basic information on reaction rates, to give you some ideas of what to include.

Wednesday, 4 December 2013

Assignment 3: Graph from part 2.

This is the last part of assignment 3. If you have produced your own version of all of these sheets, you are ready to hand in all the work for assessment.

Assignment 3: Results for part 4.

Again this set of results is to give you an idea of the relative numbers that you should expect to get from this experiment.

Assignment 3: Results for part 1.

This table of results are to show you a typical set of results from this experiment so that you can assess whether or not your experiment was carried out correctly. If your results are broadly similar to these in their value and the distribution then you can be fairly sure that you have carried out the experiment properly. This is just a guide.

Assignment 3: Graph from part 1.

The graph for part 1 can be quite tricky to produce especially getting the scales on the axes correct. This is a guide to setting up and labelling your graph correctly. Remember that you must not ever join the dots and also the points plotted on this example graph are not in the right place.

Assignment 3: Part 2 conclusions and questions.

As before this is a general outline to the kind of information that you will need for this section. Use this information as a guide to construct your own version of the work.

Assignment 3: Part 1 conclusions and questions.

This is a general guide to the kind of information that you should have in this section use it to construct your own notes.

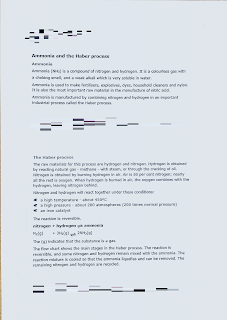
Ammonia and the Haber process.

In the assignment you will need to show that you understand how the conditions for making ammonia can be altered to improve the amount of yield that is obtained. You will need to show how and the pressure and temperature of the process are changed the amount of ammonia that is produced changes also. These notes contain the basic information that you will need, use them to construct your own assignment section.

Assignment 3: Procedure for part 1 2 3 and 4.

This is another set of information that you will need. You will need to explain how part 1 2 3 and 4 are carried out.
This is the information from the assignment brief and you should use it to construct your own procedure on how to carry out the experiments, so this is just a guide on the information that you will need to put into your assignment.


Buddy

A random pic of my dog.
"Make sure you put your name on a your worksheets, just like I do"

Assignment 3: Part 3 and 4 analysis and conclusions; the end bit of it!

This is an idea of the next bit, roughly how it should look.

Assignment 3: Part 3 and 4 Analysis and conclusions

Some general guidance on how the answers analysis and conclusion should look.

Assignment 3: Results for part 2

This is another of the tables for the third assignment and again the numbers are just for illustration as to the general trend you might expect.

Assignment 3: Results for part 3

This is one of the results tables the Yr 10 need to produce for the third assignment. The numbers are just a guide to the general trend you would expect!